Linear regression, one of the simplest and most foundational tools in machine learning, is widely used to predict outcomes based on input features. While custom coding has traditionally been the go-to method for solving linear regression problems, the emergence of Large Language Models (LLMs) like OpenAI’s ChatGPT, Google’s Gemini, and Microsoft’s Copilot has opened up exciting new possibilities. Can these LLMs generate accurate and usable code for linear regression models? This post explores that question in detail, using a dataset to predict house prices based on features such as size, number of bedrooms, number of floors and age. Python code generated by these LLMs and their outputs are compared, and their ability to scale and handle real-world constraints is examined.

LLMs and Linear Regression: A Deep Dive
One can always write a custom code to fit training sets to a Linear Regression Model. But, instead, can’t we just use publicly available LLMs (Large Language Models) such as OpenAI’s ChatGPT, Google Gemini or Microsoft Copilot?
All three LLMs were tasked with generating Python code using the Scikit-learn package and the gradient descent method using the following prompt.
Attached is a csv file called houses.99.txt and it is delimited by “,”. The first row is a header. The remainder rows contain the numerical data. The first four columns contain the input features, X_train, which are for predicting the house prices. The fifth column contains the house prices in units of 1000’s of dollars, y_train. We wish to fit a linear model y = w.X + b, where w are the weights, b is the bias value and X is the input feature set and y is the output house price in dollars. Please give a python code to determine the linear model for X_train and y_train using sklearn and the SGDRegressor. Use scaling for X_train. Please also include the code for reading X_train and y_train from the houses99.txt file. Using this code, determine the weights and bias and show the model. Calculate the weights and the bias using this code, and give the model. Print the mean and standard deviation, for each column in X_train. Finally, predict the house price for a new feature set [1200, 3, 1, 40]. Give the scaled values for this feature set. Also, provide the python code listing and let the print statements for numbers be to 8 decimal places.
A short synopsis on the Linear Regression Model is provided at the bottom for quick review. The Python code and supporting files used in this blog evaluation are available on GitHub.
Dataset Details
The houses99.txt file is a training set file that has 99 training sets. Each training set has 4 features x1 (sft), x2 (number of bedrooms), x3 (number of floors) and x4 (age in years); and 1 output for house price y ($ in 1000’s). For example:
| x1 (sft) | x2 (rooms) | x3 (floors) | x4 (age) | y ($ in 1000’s) | |
| 1st set | 1244 | 3 | 1 | 64 | 300 |
| 2nd set | 1947 | 3 | 2 | 17 | 510 |
Code Generation and Results
The objective of the prompt is to generate a linear model of the type shown here and the equation is described in the short synopsis later on in this post.

All three LLMs (ChatGPT, Gemini, and Copilot) successfully generated Python code. After running the code locally, the outputs were compared. Here are the weights and bias values they produced:
| w1 | w2 | w3 | w4 | b | |
| ChatGPT | 110.280 | -21.130 | -32.545 | -38.012 | 363.163 |
| Gemini | 110.280 | -21.130 | -32.545 | -38.012 | 363.163 |
| Copilot | 110.312 | -21.142 | -32.574 | -38.000 | 363.163 |
Taking the ChatGPT model as an example, the fitted model is:

Predictions
The above model can be used to now predict the house price. For example, for a test feature set X = [1200, 3, 1, 40], the model predicts a price of $318,793.95.
It is important to note that directly substituting the raw feature values into the model will not yield the predicted result shown. This discrepancy arises because the code applies standard normalization using the StandardScaler from sklearn.preprocessing. In this process, each data value in a column is scaled relative to the column’s mean and standard deviation. Following normalization, the column is transformed to have a mean of 0 and a standard deviation of 1. This scaling step is a necessary mathematical requirement for linear regression to ensure consistent and accurate model performance.
The before and after scaling values for the feature set X = [1200, 3, 1, 40] is shown here.
| X = | x1 (sft) | x2 (rooms) | x3 (floors) | x4 (age) |
| Unscaled | 1200 | 3 | 1 | 40 |
| Scaled | -0.53052829 | 0.43380884 | -0.78927234 | 0.06269567 |
If the scaled values of X are substituted in the model, the predicted value is $318,793.95. This seems like a lit bit of extra work and knowledge, and we know that the code can do all this scaling behind the scenes. But, would it not be nice to ask the LLMs to do this as well?
LLMs ability to run code
As of now, Microsoft Copilot has no mechanism from within its chat interface to upload the training data set (houses99.txt). But, if the python code has to be run, it can be done on Microsoft’s Azure cloud platform. There is no simple way to run.
ChatGPT provides the ability to upload the training data set. After uploading, and asking it run the model prompt, it can be tasked to predict the house prices for the test training set, [1200, 3, 1, 40]. ChatGPT would do the necessary conversions and give the result, like the one shown here. This is quite cool!

It would be difficult to do this on the free tier of ChatGPT. By subscribing to the Plus tier, which costs about $20/month, file upload is enabled. However, it is also not possible to upload a very large training set, say with a thousand or million training data sets. This is what ChatGPT had to say on this matter.
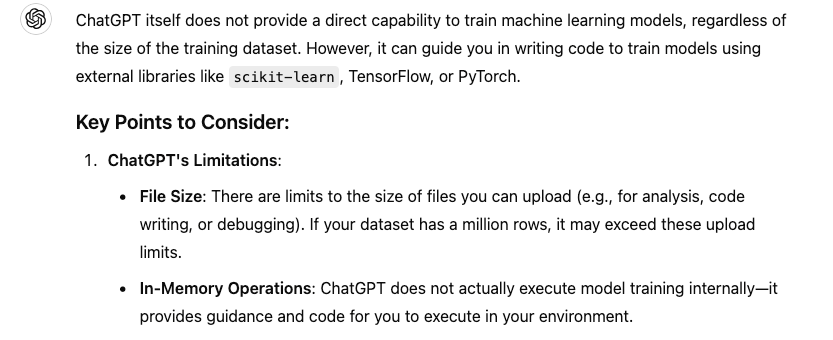
For very large training data sets, it would be practical to run the code on a custom environment, where one had total control of the computing power, memory and data management. But, for small data sets, at least for the sizes used in this experiment, we can accomplish some quick analysis on this LLM.
Google’s Gemini does not have a mechanism to upload a file for analysis. However, Gemini Advanced offers such services, but it is subscription based ($19.99/month). Google is also offering a code writing and testing platform called Google AI Studio, which is free at the moment. But, I’m sure it will be subscription based soon. I was able to run the prompt on the Google AI Studio and also run it. Here are the results.
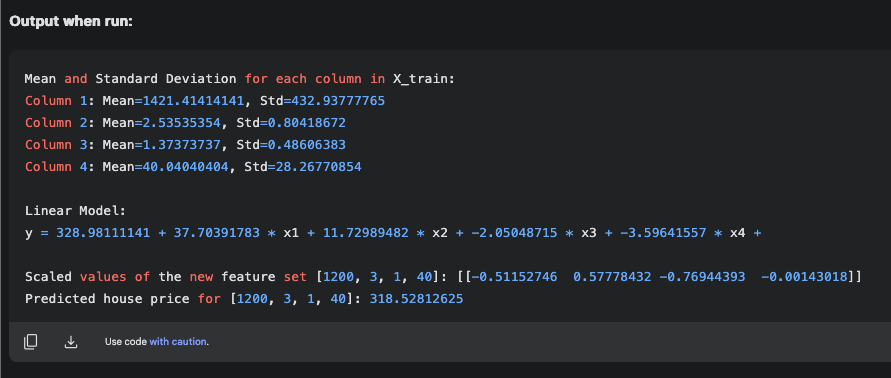
The code upon running has given a linear model with w and b values that are very different from that obtained when the same code is run on a local computer, as shown in the earlier table. However, it predicts the correct price of $318,528.12 for the new feature set [1200, 3, 1, 40]. Its in the same ballpark as the code run on an independent computer. However, since the weights and bias values are similar when the code from each of the three LLMs are run on the same computer, I would personally not rely on the code output given by Google AI Studio.
Summary
All three public LLMs – ChatGPT, Gemini and Copilot generate excellent python code to predict a linear regression model by the gradient descent method and the Scikit-learn package. When the codes are run on the same computer, they produce weights and bias values that are identical. They also predict the output correctly for a new input feature set. ChatGPT and Google AI Studio can run the python code from within the chat window, for small data sets, such as the 99 training sets in our experiment. However, for larger training sets, we have to use custom computing environments. Microsoft pilot does not offer any free tier service to upload and test models. Nevertheless, the ability for all three LLMs to write code correctly is impressive.
Linear Regression Models – a quick review…
We try to predict things every day. The weather channel predicts the temperature. The financial analyst predicts the future value of the stock price. The airlines predict the time of arrival of an aircraft. We live in a world filled with predictions. How is it done?
One way is to make a random guess. But, this has a very low probability of being correct. We are not fortune tellers! Another way is to create a model to predict an output ‘y’ for a given set of input features ‘X’. We could write the relationship as:

In real world problems the feature set ‘X’ would be one or more input variables. For example, we may want to predict the house price (y) given its sft, number of bedrooms, number of floors and its age. Here, the feature set X has 4 input variables – x1, x2, x3 and x4. Mathematically this is called as a 1D array of 4 variables. We could write it as:

But, what is the function that can predict y?
A well known function is a model based on Linear Regression and it is written as follows:
In short form it is written as 

What if we had a data set for 10,000 houses? You can imagine this as a 10,000 row data set in MS Excel, with each data row having 5 columns, 4 for the X data and 1 for the y data. This is a 2-D array of size 10,000 rows x 5 columns, which is a matrix of size (10000×5). Would the linear model work and fit all the 10,000 data rows for some unique values of w (i.e. w1, w2, w3 and w4) and b? Of course, the earlier values of w determined with 5 feature sets is unlikely to work for the 10,000 data set, since the problem is overdetermined. Instead, in linear regression, a best fit is established by choosing w iteratively, so that the square of the error between the real value (y) and the predicted value
If linear regression is applied to the 10,000 data set problem (each called a training set), the error is based on the least squares method, but it is summed over all the training sets. This summed value is known as the “Cost Function” in the language of Machine Language (ML). One popular technique to iteratively compute the weights w and the bias b, is known as the Gradient Descent (GD) method. This type of linear model, where the linear regression model is fit to a training data set is popularly known as Supervised Learning in ML and AI.
Acknowledgements
The houses99.txt data file has been adopted from the data set used in the course Supervised Machine Learning: Regression and Classification by Andrew Ng, which is offered jointly by Stanford University Online and DeepLearning.AI, through Coursera. This is an excellent course for learning Machine Learning through writing code and algorithms.
