Part 2: Estimating Individual Treatment Effects with the T-Learner
Estimating the average effectiveness of a treatment across a patient population is an important first step in evidence-based medicine. However, physicians treat individual patients rather than populations, and the expected benefit of the same treatment may differ substantially from one patient to another. This article introduces the concept of the Individual Treatment Effect (ITE) and demonstrates how causal machine learning can be used to estimate personalized treatment benefits. Using a synthetic oncology dataset, a T‑learner architecture based on two Random Forest models is developed to estimate the expected clinical outcome under both treated and untreated scenarios for the same patient. The difference between these two predicted outcomes provides an estimate of the patient’s individualized treatment benefit and forms the basis of a prototype Clinical Decision Support (CDS) system. The article also discusses model evaluation, interpretation, limitations, and the role of AI in supporting, rather than replacing, physician decision making. Together with Part 1, this article provides a practical introduction to causal inference and individualized treatment-effect estimation for healthcare professionals, engineers, students, and data scientists interested in AI-assisted Clinical Decision Support.

Estimating the average effectiveness of a treatment across a patient population is an important first step in evidence-based medicine. However, physicians treat individual patients rather than populations, and the expected benefit of the same treatment may differ substantially from one patient to another. This article introduces the concept of the Individual Treatment Effect (ITE) and demonstrates how causal machine learning can be used to estimate personalized treatment benefits. Using a synthetic oncology dataset, a T‑learner architecture based on two Random Forest models is developed to estimate the expected clinical outcome under both treated and untreated scenarios for the same patient. The difference between these two predicted outcomes provides an estimate of the patient’s individualized treatment benefit and forms the basis of a prototype Clinical Decision Support (CDS) system. The article also discusses model evaluation, interpretation, limitations, and the role of AI in supporting, rather than replacing, physician decision making. Together with Part 1, this article provides a practical introduction to causal inference and individualized treatment-effect estimation for healthcare professionals, engineers, students, and data scientists interested in AI-assisted Clinical Decision Support.
From Average Patients to Individual Patients
In the previous article, we explored one of the central questions of causal inference:
Does a treatment improve outcomes, on average, across a patient population?
Using a synthetic clinical dataset, we demonstrated how treatment-selection bias and confounding can lead to misleading conclusions, and how propensity scores together with Inverse Probability Weighting (IPW) help produce a more credible estimate of the Average Treatment Effect (ATE).
The Average Treatment Effect is an important quantity for clinical research, public health, and healthcare policy because it summarizes the expected benefit of a treatment across an entire population. However, physicians rarely make treatment decisions for the “average” patient.
Every patient presents with a unique combination of age, disease stage, biomarkers, performance status, medical history, and many other clinical characteristics. Two patients with the same diagnosis may respond very differently to the same treatment. One patient may experience a substantial benefit, another only a modest improvement, a third may derive little or no benefit, while a fourth may actually be harmed by the treatment.
The physician’s question therefore changes from a population-level perspective to an individual one:
Will this treatment benefit the patient sitting in front of me?
Answering this question requires a different way of thinking. Instead of estimating a single treatment effect for an entire population, we seek to estimate the treatment effect for each individual patient. This quantity is known as the Individual Treatment Effect (ITE).
The goal of this article is to introduce the fundamental concepts behind estimating individualized treatment effects using machine learning. Building upon the synthetic dataset developed in Part 1, we will demonstrate how a T-learner constructs two predictive models, one representing treatment and the other representing no treatment, to estimate personalized treatment benefits. These estimates then become the foundation of a simple AI-assisted Clinical Decision Support (CDS)system.
As in the previous article, the objective is educational rather than clinical. The emphasis is on developing an intuitive understanding of the methodology rather than the underlying programming or mathematical details.
The Individual Treatment Effect (ITE)
In Part 1, we introduced the Average Treatment Effect (ATE), which estimates the expected benefit of a treatment across an entire patient population. While the ATE is valuable for clinical research and healthcare policy, it cannot tell us how much a particular patient is expected to benefit from the treatment.
To answer this question, we introduce the Individual Treatment Effect (ITE). Rather than estimating a single treatment effect for an entire population, the ITE estimates the treatment benefit for one specific patient based on that patient’s unique clinical characteristics.

Figure 1. Conceptual illustration of the Individual Treatment Effect (ITE). For a single patient with fixed clinical characteristics, two potential outcomes are estimated: the predicted survival probability if treated and the predicted survival probability if untreated. The estimated Individual Treatment Effect is the difference between these two predicted outcomes. In real clinical practice, only one of these outcomes is ever observed; the other remains the counterfactual.
For this demonstration, the clinical outcome of interest is the probability of surviving one year. The estimated Individual Treatment Effect is therefore defined as the difference between two predicted outcomes for the same patient: For this demonstration, the outcome of interest is the probability of surviving one year. The Individual Treatment Effect can therefore be expressed as:
Estimated ITE = Predicted Survival if Treated − Predicted Survival if Untreated
Mathematically, this is written as:
where:


Figure 1 illustrates this concept. For a single patient with fixed clinical characteristics, two hypothetical outcomes are estimated, one assuming the patient receives treatment and the other assuming the patient does not. The difference between these two predicted outcomes represents the estimated Individual Treatment Effect.
An estimated ITE greater than zero suggests that the treatment is expected to improve the patient’s probability of surviving one year. An estimated ITE close to zero indicates little expected benefit, while a negative estimated ITE suggests that the treatment may not be beneficial and could potentially be associated with a poorer outcome than the alternative.
There is, however, an important distinction between this synthetic demonstration and real clinical practice. Because the dataset was deliberately engineered, the True ITE is known for every synthetic patient. This allows us to objectively evaluate how accurately our machine learning model estimates individualized treatment effects.
In real-world healthcare, the True ITE is never observed. We only observe the outcome corresponding to the treatment that was actually received. The alternative outcome, the counterfactual, remains unknown. Consequently, a Clinical Decision Support system can estimate the treatment benefit for an individual patient, but it can never know the true treatment effect with certainty. Its role is to provide evidence that supports, rather than replaces, clinical judgment.
Why Machine Learning?
The previous section introduced the concept of the Individual Treatment Effect (ITE) as the difference between two potential outcomes for the same patient. The natural question is:
How can these two outcomes be estimated?
Traditional statistical models often assume relatively simple relationships between patient characteristics and clinical outcomes. In practice, however, patient responses are influenced by many interacting factors. Age, disease stage, biomarkers, performance status, smoking history, genetics, and other clinical variables may all contribute to treatment response, often in complex and nonlinear ways.
Machine learning provides a flexible framework for learning these relationships directly from historical patient data. Rather than assuming a predetermined mathematical equation, machine learning algorithms discover patterns by analyzing large numbers of patient records. This ability to model complex interactions makes machine learning particularly attractive for estimating individualized treatment effects.
For this demonstration, we use a Random Forest Regressor, although many other machine learning algorithms could also be employed. The objective is not to identify the “best” machine learning model, but to demonstrate the fundamental concept of personalized treatment-effect estimation. The methodology described in this article is therefore independent of the specific machine learning algorithm.
The key idea is surprisingly simple. Instead of building a single predictive model for all patients, we build two separate models:
- one model learns from patients who received the treatment, and
- a second model learns from patients who did not receive the treatment.
Each model estimates the probability of one-year survival under its respective treatment condition. For any individual patient, both models can then be used to estimate the two potential outcomes required to calculate the Individual Treatment Effect.
This approach forms the basis of the T-learner, one of the simplest and most intuitive methods for estimating individualized treatment effects. The next section introduces the T‑learner architecture and demonstrates how these two predictive models work together to estimate personalized treatment benefits.
The T-Learner: Estimating Individual Treatment Effects
The T-learner provides a remarkably intuitive solution to the problem introduced in the previous section: how can we estimate the two potential outcomes for the same patient? Its name is derived from the use of two independent predictive models, one for patients who received the treatment and another for patients who did not.
Unlike conventional predictive modeling, the objective of the T-learner is not merely to predict a clinical outcome. Instead, it seeks to estimate what would happen under both treatment scenarios for every individual patient.
Using the historical patient data, the T-learner first separates the dataset into two groups:
- patients who received the treatment, and
- patients who did not receive the treatment.
A separate machine learning model is then trained for each group. In this demonstration, both models use the Random Forest Regressor algorithm, although the methodology is equally applicable to many other machine learning algorithms.
For this synthetic dataset, the selected outcome variable (Y) is the probability of one-year survival. This outcome was intentionally chosen for educational purposes because it is intuitive and easy to interpret. In practice, however, the outcome variable can represent any clinically meaningful endpoint, depending on the application. Examples include three-year or five-year survival, disease recurrence, hospital readmission, treatment response, adverse events, quality-of-life measures, or any other outcome of interest.
The first model learns the relationship between the patient characteristics and the selected clinical outcome for patients who received treatment. The second model learns the corresponding relationship for patients who did not receive treatment. Each model therefore estimates the expected outcome under one specific treatment scenario.
In supervised machine learning, the selected clinical endpoint is commonly denoted by the outcome variable 

Once both models have been trained, a new patient can be evaluated. As introduced in Part 1, the patient’s baseline covariates, or features (X) in machine learning terminology, are presented to both models, regardless of the treatment that the patient may ultimately receive.

Figure 2. Workflow of the T-learner for estimating the Individual Treatment Effect (ITE). Historical patient data are separated into treated and untreated groups to train two independent machine learning models. For a new patient with baseline covariates (features X), both models estimate the selected clinical outcome under the treated and untreated scenarios. The difference between these two predicted outcomes, 
The first model estimates the expected outcome if the patient were treated, while the second estimates the expected outcome if the same patient were untreated. The difference between these two predicted outcomes is the estimated Individual Treatment Effect. Figure 2 illustrates the workflow of the T-learner used in this study.
The important observation is that both predictions are generated for the same patient. The machine learning models are not predicting outcomes for two different patients, but rather estimating two hypothetical outcomes for one individual under two different treatment scenarios. This distinction is fundamental to personalized Clinical Decision Support.
The estimated Individual Treatment Effect then becomes a quantitative measure of the expected treatment benefit. Positive values indicate that treatment is expected to improve the patient’s probability of survival, values close to zero suggest little expected benefit, while negative values indicate that treatment may not be advantageous for that particular patient.
The T-learner therefore transforms historical observational data into individualized treatment-effect estimates, providing physicians with quantitative evidence that can support treatment decisions. Importantly, these estimates should be viewed as decision-support information rather than definitive clinical recommendations. The physician remains responsible for integrating these estimates with clinical judgment, patient preferences, medical history, and other relevant considerations before selecting the most appropriate course of treatment.
Building the Synthetic Clinical Decision Support System
The previous section introduced the T-learner as a machine learning framework for estimating Individual Treatment Effects. The next step is to apply this methodology to the synthetic dataset developed in Part 1 and construct a simple Clinical Decision Support (CDS) system.
The workflow closely follows a typical supervised machine learning pipeline. Using the historical patient dataset, the treated and untreated patient populations are first separated according to their treatment status. A Random Forest regression model is then trained independently on each group to learn the relationship between the baseline covariates (features X) and the selected clinical outcome (Y).
Once the two models have been trained, they are retained as independent predictive models. For every new patient, the same baseline covariates are supplied to both models. The treated model estimates the expected clinical outcome assuming the patient receives treatment, while the untreated model estimates the expected outcome assuming the patient does not receive treatment.
The estimated Individual Treatment Effect is then calculated as the difference between these two predicted outcomes:
This estimated treatment effect forms the quantitative basis of the Clinical Decision Support recommendation.
For the purposes of this demonstration, the CDS uses a simple decision rule:
- Positive estimated ITE: Treatment is expected to improve the selected clinical outcome.
- Estimated ITE close to zero: Little or no expected treatment benefit.
- Negative estimated ITE: Treatment may not be beneficial and should be carefully reconsidered in conjunction with other clinical information.
It is important to emphasize that this decision rule is intentionally simplified for educational purposes. Real-world Clinical Decision Support systems would incorporate many additional considerations, including confidence intervals, uncertainty estimates, treatment risks, contraindications, patient preferences, physician judgment, clinical guidelines, and cost-benefit analyses.
The objective of this synthetic demonstration is therefore not to replace clinical decision making, but to illustrate how machine learning can estimate individualized treatment benefits using historical observational data.
How Well Did the T-Learner Perform?
One advantage of using a synthetic dataset is that the True Individual Treatment Effect (True ITE) is known for every patient. This provides a unique opportunity to objectively evaluate how accurately the T-learner estimates individualized treatment effects.
In real-world clinical datasets, the True ITE is never observed because only one treatment outcome is available for each patient. Consequently, the accuracy of individualized treatment-effect estimates cannot be measured directly. Synthetic data therefore provide a valuable testing environment for understanding the strengths and limitations of personalized Clinical Decision Support systems.
To evaluate the T-learner, two commonly used regression metrics were computed:
- Mean Absolute Error (MAE), which measures the average difference between the estimated and True ITE values.
- Coefficient of Determination (R2), which measures how well the estimated ITE values explain the variation in the True ITE values across individual patients.
Figure 3 compares the estimated Individual Treatment Effects with the corresponding True Individual Treatment Effects for all patients in the test dataset.

Figure 3. Comparison of the True Individual Treatment Effect (True ITE) and the Estimated Individual Treatment Effect (Estimated ITE) obtained using the T-learner. Each point represents one patient in the test dataset. The dashed line represents the ideal prediction line, where the estimated treatment effect is exactly equal to the True ITE. Although considerable scatter is observed around the ideal line, reflecting the difficulty of estimating individualized treatment effects, the overall positive trend indicates that the model captures the general relationship between patient characteristics and treatment benefit.
The T-learner achieved a Mean Absolute Error (MAE) of 0.0924, indicating that, on average, the estimated Individual Treatment Effect differed from the True ITE by approximately 0.09 probability units. The model also produced an R² value of –0.8811, indicating that it did not accurately reproduce the patient-specific treatment effects observed in the synthetic dataset. Estimating Individual Treatment Effects is inherently challenging because the treatment effect is obtained as the difference between two independently predicted potential outcomes rather than from a single prediction.
At first glance, Figure 3 suggests that the T-learner struggles to accurately estimate individualized treatment effects. The broad scatter of points around the ideal prediction line and the negative coefficient of determination indicate that the model captures relatively little of the patient-to-patient variation in treatment benefit. Although the MAE remains reasonably small because the treatment effects themselves span a relatively narrow range, the negative R² highlights an important practical limitation.
The relatively poor R² observed in this demonstration emphasizes an important distinction between understanding a methodology and deploying it in clinical practice. Although the T‑learner successfully illustrates how individualized treatment effects can be estimated, the resulting model would not yet be considered sufficiently accurate for use in a real Clinical Decision Support (CDS) system. In practice, such systems require substantially stronger predictive performance, extensive external validation, calibration studies, and prospective clinical evaluation before they can be used to support physician decision making.
Nevertheless, the objective of this demonstration is educational. The synthetic dataset provides a controlled environment in which the complete causal inference workflow can be understood, from estimating potential outcomes to computing individualized treatment effects. More sophisticated causal machine learning methods, larger clinical datasets, and richer patient features would be expected to produce substantially better performance in real-world applications.
An encouraging observation nevertheless emerges when the treatment effects are averaged across the patient population. The mean True ITE was 0.0425, while the mean Estimated ITE was 0.0441. The close agreement between these two values indicates that the T-learner successfully captured the overall magnitude of the treatment benefit, even though considerable variability remained in the patient-specific estimates. This distinction is important. A model may provide useful population-level insights while still exhibiting substantial uncertainty in individual patient predictions. Improving the accuracy of individualized treatment-effect estimation remains an active area of research in causal machine learning and represents an important direction for future work.
The purpose of this demonstration is therefore not to present a clinically validated prediction model, but rather to illustrate the complete workflow for estimating individualized treatment effects and incorporating them into an AI-assisted Clinical Decision Support system.
From the T-Learner to Clinical Decision Support
The ultimate goal of estimating Individual Treatment Effects is not to produce another machine learning metric, but to assist physicians in making more informed treatment decisions. This is where the T-learner becomes the foundation of a Clinical Decision Support (CDS) system.
Consider a physician evaluating a newly diagnosed patient. The patient’s baseline covariates (features X) are entered into the CDS, either manually or automatically from the electronic health record. These features are then supplied to both T-learner models.
The treated model estimates the patient’s expected clinical outcome if the treatment is administered, while the untreated model estimates the expected outcome if treatment is withheld. The difference between these two predicted outcomes is the estimated Individual Treatment Effect.
Rather than presenting only a numerical value, a practical CDS would summarize the results in a form that is easy for clinicians to interpret. For example, the system could display the predicted outcome under both treatment scenarios, the estimated treatment benefit, and a concise explanation of how the recommendation was derived. This allows physicians to understand not only the recommendation itself, but also the reasoning behind it.
Importantly, the estimated Individual Treatment Effect should not be interpreted as a definitive recommendation to treat or not to treat. It is one piece of evidence among many that clinicians consider when making patient-care decisions. Medical history, laboratory findings, imaging studies, treatment risks, patient preferences, comorbidities, and clinical guidelines all remain essential components of the final decision.
The value of a Clinical Decision Support system lies in its ability to rapidly perform complex calculations that are impossible to carry out mentally during a patient consultation. Rather than replacing physician expertise, the system augments it by providing quantitative estimates derived from historical patient data.
The synthetic demonstration presented in this article represents a simplified proof of concept. Nevertheless, it illustrates an important principle: once individualized treatment effects can be estimated reliably, they can be incorporated into interactive software tools that provide personalized, evidence-based decision support at the point of care.
A Worked Clinical Example
The concepts presented thus far become much easier to appreciate when viewed through the lens of an individual patient. To illustrate the workflow of the T-learner within a Clinical Decision Support (CDS) system, consider the synthetic patient shown below. Although this patient is entirely computer generated, the clinical characteristics were chosen to resemble those commonly encountered in oncology practice.
Table 1. Clinical characteristics (features X) of a representative synthetic patient used to illustrate the Clinical Decision Support workflow.
| Clinical Variable | Value |
| Age | 68 years |
| Smoking history | 35 pack-years |
| Disease stage | III |
| Performance status | 1 |
| Biomarker positive | Yes |
As with any new patient, the baseline covariates (features X) are supplied simultaneously to both T-learner models. One model estimates the expected clinical outcome assuming the patient receives treatment, while the second estimates the expected outcome assuming treatment is not administered. The difference between these two predicted outcomes is the estimated Individual Treatment Effect.
For this patient, the Clinical Decision Support system produced the following estimates:
- Predicted one-year survival without treatment: 15.1%
- Predicted one-year survival with treatment: 38.1%
- Estimated Individual Treatment Effect: 23.0 percentage points
Based on these estimates, the CDS concludes that the treatment is likely to be beneficial for this patient.
Figure 4 illustrates the deployed Clinical Decision Support application developed for this demonstration. Users specify baseline patient characteristics, including age, smoking history, disease stage, performance status, and biomarker status. The application estimates the predicted one-year survival probabilities under treatment and no-treatment scenarios, computes the Individual Treatment Effect (ITE), and presents an educational treatment recommendation. The application demonstrates how causal machine learning models can be integrated into an interactive Clinical Decision Support workflow.
The live demonstration is available at models.mlpowersai.com and is intended solely for educational purposes using synthetic patient data.

Figure 4. Interactive Clinical Decision Support (CDS) application demonstrating individualized treatment-effect estimation using the deployed T-learner model. Users enter patient characteristics, and the system estimates predicted one-year survival with and without treatment, the individualized treatment benefit, and an educational treatment recommendation.
At first glance, the recommendation appears straightforward. However, the true value of the CDS lies not in the recommendation itself, but in the quantitative evidence that supports it. Rather than simply stating that treatment is recommended, the system explains why. In this example, the model estimates that treatment increases the patient’s probability of surviving one year by approximately 23 percentage points, a difference that may be clinically meaningful.
Equally important is recognizing what the CDS does not do. It does not account for every aspect of patient care. Factors such as treatment toxicity, coexisting medical conditions, quality of life, patient preferences, cost, and physician experience remain essential components of the final clinical decision. The CDS therefore serves as an additional source of evidence, complementing rather than replacing physician judgment.
This simple example illustrates the central idea behind individualized Clinical Decision Support. Every patient enters the system with a unique set of clinical characteristics. Instead of relying solely on the average treatment benefit observed across an entire population, the CDS estimates the expected benefit for that individual patient. Although the estimates are imperfect and subject to uncertainty, they represent a meaningful step toward more personalized, data-driven medicine.
Future Direction
Although this demonstration uses a synthetic dataset, it illustrates a broader direction for the future of AI-assisted Clinical Decision Support. We only see the outcome corresponding to the treatment that was actually received, while the alternative outcome remains an unobservable counterfactual.
Despite this fundamental limitation, causal machine learning provides a practical framework for estimating individualized treatment benefits from historical observational data. The T-learner presented in this article illustrates one of the simplest approaches to addressing this problem. By independently modeling the treated and untreated patient populations, it becomes possible to estimate how a particular patient may respond under two different treatment scenarios and to quantify the expected treatment benefit.
This demonstration intentionally used a synthetic dataset with a known ground truth. Although the predictive accuracy at the individual patient level remains imperfect, the exercise provides valuable insight into how causal inference and machine learning can be combined to build Clinical Decision Support systems. More importantly, it establishes a framework that can be extended to real-world healthcare datasets using more advanced causal machine learning methods.
The examples presented in this two-part series represent an educational proof of concept rather than a clinically validated decision-support tool. Real-world implementation would require carefully curated clinical data, rigorous model validation, regulatory oversight, prospective evaluation, and close collaboration between physicians, data scientists, and healthcare organizations.
Nevertheless, the underlying vision is compelling. Instead of relying solely on population averages, future Clinical Decision Support systems will increasingly estimate treatment benefits for individual patients, helping physicians make more personalized, evidence-based decisions. Artificial intelligence will not replace clinical expertise, but it can augment it by rapidly analyzing complex patient data and providing quantitative estimates that would otherwise be impossible to calculate during a clinical consultation.
For me, this project has also been a valuable learning exercise. Building the synthetic dataset, implementing the T-learner, and critically evaluating its performance have reinforced an important lesson: successful AI in healthcare is not simply about training predictive models. It requires understanding the underlying causal questions, carefully interpreting the results, and recognizing both the strengths and limitations of the methodology.
Related Resources
This article is part of an educational series on causal machine learning and Clinical Decision Support.
- Companion Article (Part 1):
Why Prediction Is Not Enough: A Practical Introduction to Causal Inference for Clinical Decision Support - Companion Article (Part 2):
Why Personalized Treatment Effects Matter: Building AI-Assisted Clinical Decision Support with a T-Learner - Live Clinical Decision Support Demonstration:
https://models.mlpowersai.com/cds-estimate.html
Call to Action
Explore the live Clinical Decision Support demonstration and discover custom Healthcare AI solutions.
The Clinical Decision Support application described in this article is now available as an interactive demonstration.

MLPowersAI develops custom machine learning and causal AI solutions for healthcare, life sciences, and process industries. We build deployment-ready applications that transform data into practical decision-support tools while maintaining scientific transparency and interpretability.
Our expertise spans predictive machine learning, causal inference, clinical decision support, digital twins, and AI agents for scientific and industrial applications.
🔗 Visit us at MLPowersAI.com
🔗 Connect via LinkedIn for discussions or collaboration inquiries.
Acknowledgement
The opening illustration was created using Google’s Flow image generation system based on a prompt developed collaboratively by the author and OpenAI’s ChatGPT. Figures 1 and 2 were created using OpenAI’s ChatGPT image generation capabilities. Figure 3 was generated programmatically from the author’s Python code within a Jupyter Notebook. Figure 4 is a screenshot of the deployed Clinical Decision Support (CDS) web application developed by the author using FastAPI and a custom HTML/CSS/JavaScript interface. The scientific concepts, figure design, interpretation, and accompanying captions were developed, reviewed, and validated by the author.








 were set at 0.8, 1.0, 0.5, 0.6, 0.4, and 0.3 respectively.
  are the activation energy (0.5 eV) and universal gas constant (8.617×10⁻⁵ eV/K) respectively.
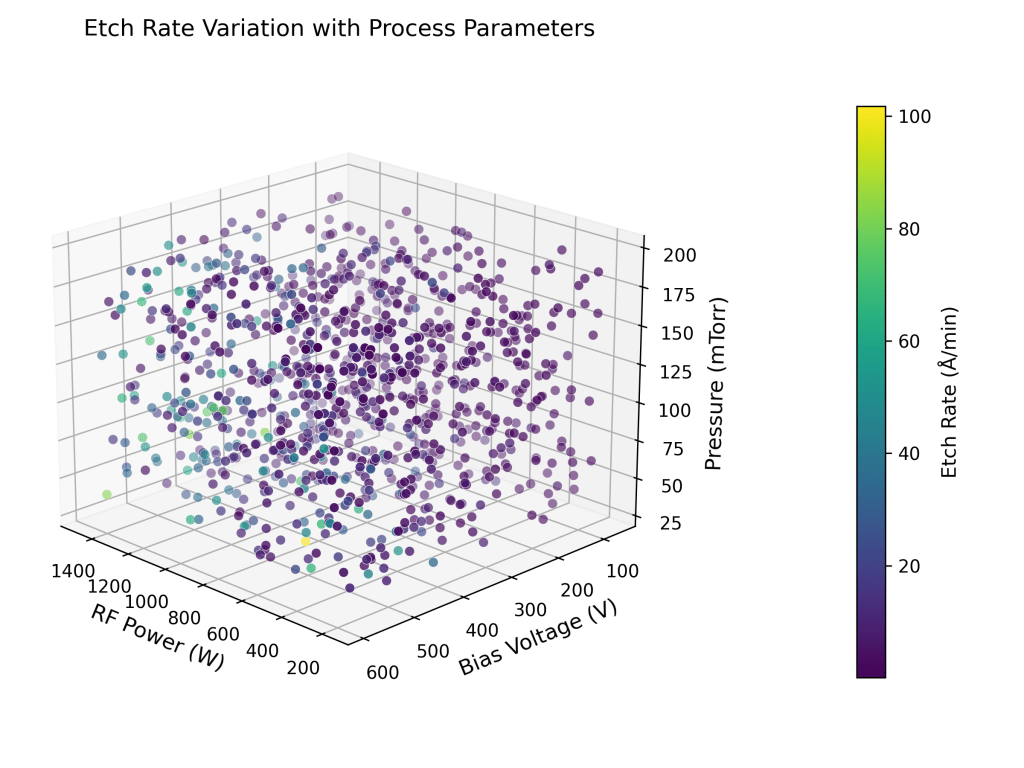
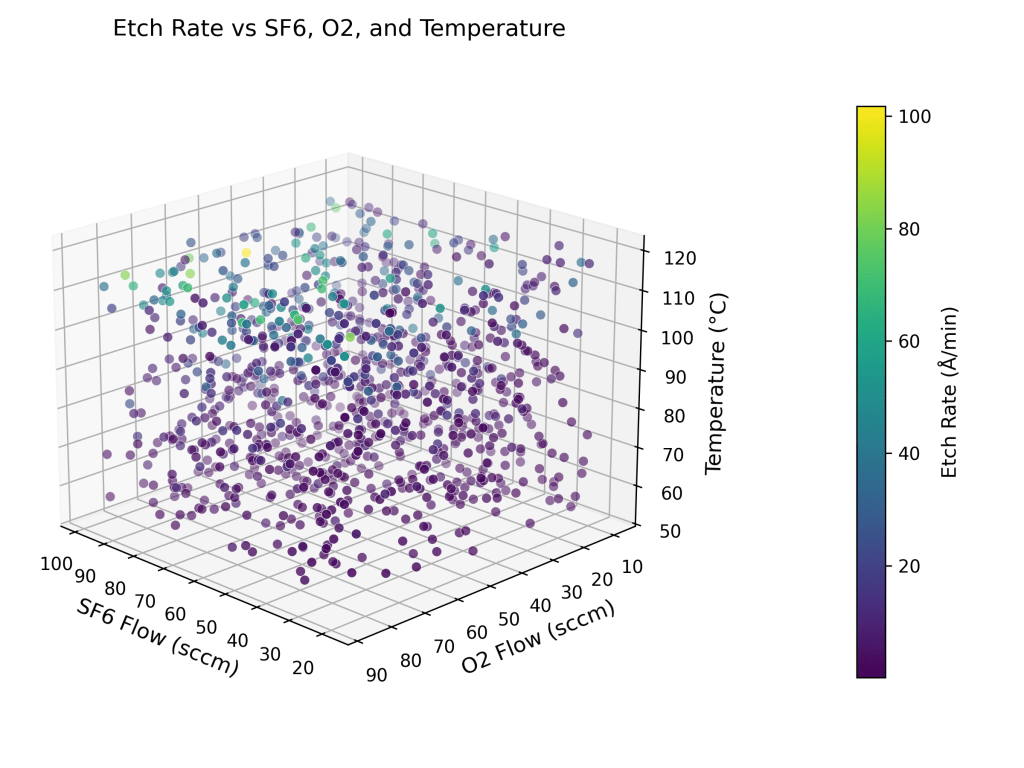
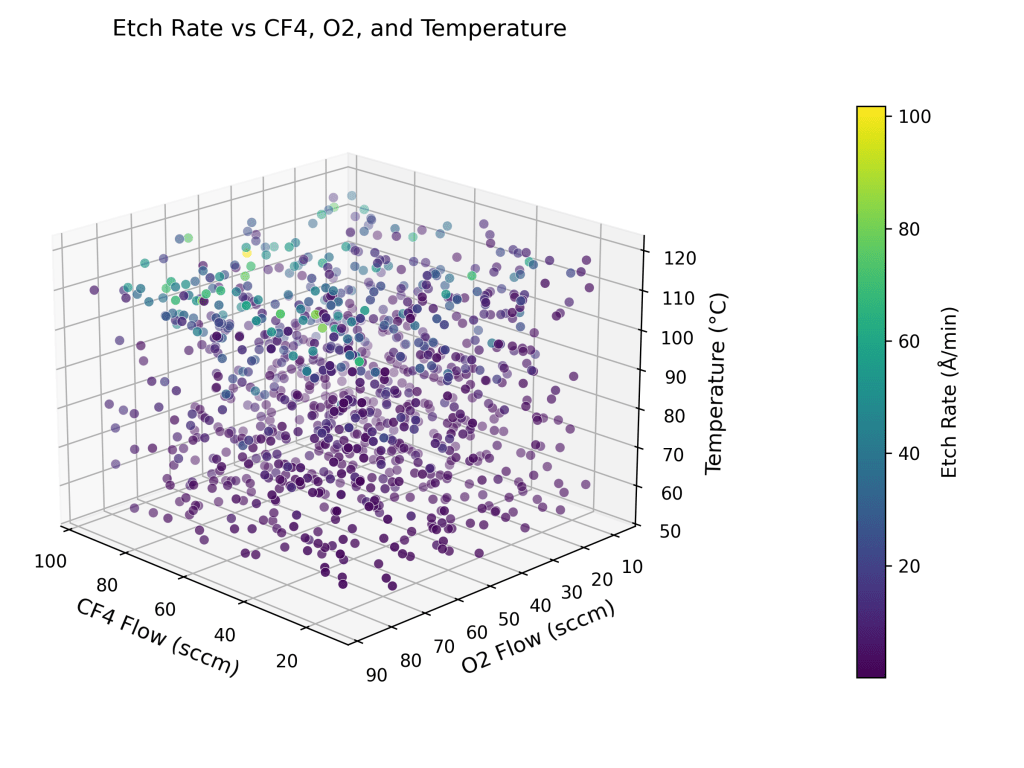
  are the controllable process variables – plasma power (W), bias voltage (V), pressure (mTorr), flow rates of gases (sccm) and temperature (C, converted to K) respectively.










 and
and  are the exit concentration of A and fluid temperature
  . Since the residence time is long enough to reach steady state, for this irreversible reaction,
  CA_ss
CA_ss T_ss
T_ss 100 L (tank volume)
 -50,000 J/mol (heat of exothermic reaction)
 1 Kg/L (fluid density)
 4184 J/Kg.K (fluid specific heat capacity)
 0.1 min-1, and where
  is the reaction rate (mol/L.min).








 , where w is a 1-D vector and X is a matrix. Here, y has a funny upward pointing arrow symbol, called as y-hat, indicating that it is a predicted value. Further, w.X is known as the dot product of vector w with matrix X. In this illustration, the matrix X is a 1-D vector, since we are dealing with only one feature set. The math challenge is to determine w1, w2, w3 and w4, which are called as the model weights, and to determine, b, which is known as the bias. There are 5 unknowns and if we had 5 equations, the unknowns could be solved for simultaneously. For example, if we had the data for 5 houses, we could generate 5 equations based on the model. Therefore, we can develop a model prediction for y. However, it would be an equation that would satisfy the 5 feature sets, i.e. given one of the 5 known feature sets, it would give an estimate for
  .
.
